
If you work in LP operations, you know this situation.
Your portfolio has dozens of fund commitments and hundreds of underlying portfolio companies. Every quarter, reports come in on all of them. But the team can only give real attention to a fraction. The largest exposures, the funds coming up for re-up, the ones where something is already going wrong.
The rest sit in a folder. Not because they do not matter, but because there is no practical way to follow everything at the same depth.
Over time this creates a gap. The top of the portfolio is well understood. The bottom is not. A fund where a portfolio company has declined two quarters running does not get flagged until the next re-up conversation, and by then the insight comes too late to be useful. A sector that was 12% of the underlying portfolio six months ago has quietly grown to 18%, but nobody saw it because it happened across five different funds.
The real cost is not that the reports go unread. It is that future investment decisions, re-ups, co-investments, and portfolio construction choices, are made without quality insight into the full portfolio. The monitoring work that should feed those decisions never happened for the exposures that did not make the cut.
Closing the loop
We built FundFrame to close that gap.
The idea is that the platform monitors the full portfolio for you. It extracts the quarterly data, turns it into structured and comparable numbers, and flags the portfolio companies and funds that need attention. The team focuses on their most critical exposures while still getting insight into even their smallest ones.
That means monitoring does not just support quarterly reporting and valuation. It feeds the investment decisions that come after. When a re-up comes around, the insight is already there. When the board asks about a specific exposure, the answer does not require going back to the original reports.
Our first step
This summer we produced an AI-generated portfolio monitoring report for one of our customers. Here is what it covers and why each part matters.
Revenue and EBITDA on a comparable basis. GPs report in different formats. Some give quarterly numbers, some year to date, some last twelve months. The report normalises everything to LTM so that portfolio companies sit side by side regardless of how the GP presented the data. Without this, any cross-portfolio view is misleading.
Sector and geography at the portfolio company level. Most LPs know their allocation at the fund level. Fewer have a clear picture at the portfolio company level. The report maps this out and shows how it has moved since the previous quarter. Drift that is invisible at the fund level becomes obvious here.
A prioritised list of what needs attention. Rather than presenting every portfolio company equally, the report flags where something has changed. A company where value has declined, a fund where the underlying mix has shifted, a sector where concentration has grown. The team gets a short list to work from, not a stack of documents.
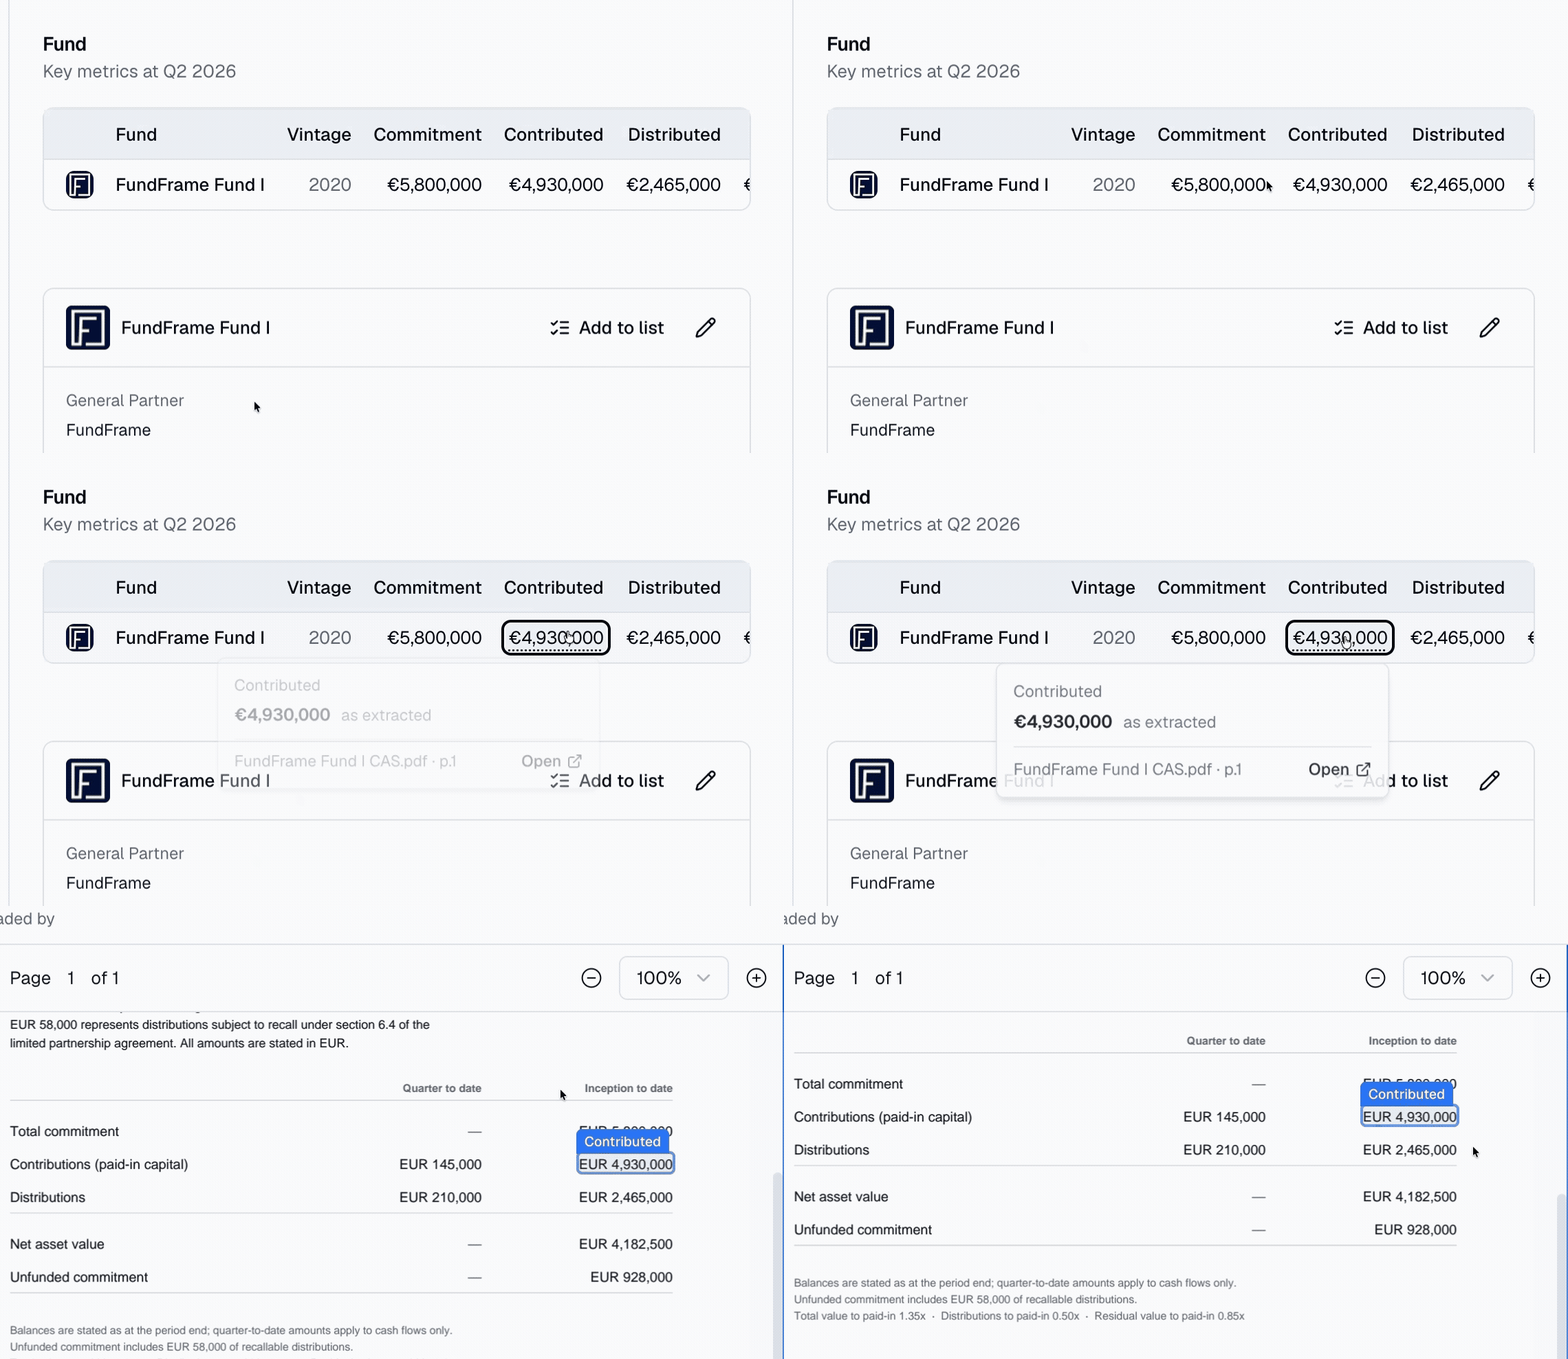
Every figure traceable to its source. We built click-through into FundFrame over the summer. Every extracted value carries the exact position on the page it was read from. Click a number and the original document opens with that figure highlighted. The report is only useful if the team trusts the numbers, and the fastest way to build that trust is to let them see the source in one click.
What this means in practice
The report supports the monitoring and valuation work that already happens in both finance teams and investment teams. It does not replace judgement. It means the team walks into the quarterly review with the reading done and the priorities identified, and crucially, with insight that covers the full portfolio rather than just the top of it.
For the finance team, it provides a structured basis for the quarterly valuation process. For the investment team, it surfaces what needs a conversation with the GP before the GP raises it themselves. And for both, it means the next re-up decision is backed by a full monitoring history, not a scramble to catch up on a fund that fell off the radar.
How the feedback has been
We delivered the first report to our customer this summer. The feedback has been very positive. The report will be presented at their board meeting later this month, and we have already had inbound interest from other LPs who want the same.
We are not calling this finished. There are things that did not work well, and parts of the process that are still more manual than we want them to be. We plan to share those learnings openly as we go.
What comes next
The direction is clear to us. FundFrame extracts the quarterly data, structures it, monitors it, and tells you where to look. The team focuses on what matters. FundFrame handles the rest. The monitoring feeds back into the investment process so that the next decision is better than the last one.
If your team recognises any of this, we would like to talk. Reach out at [email protected].
Alexander Rønfeldt Operations Lead, FundFrame